Basic descriptive analysis
This page is a part of PSPP Guide.
Frequencies
To compute frequency distribution of a variable, go to Analyze – Descriptive statistics – Frequencies.
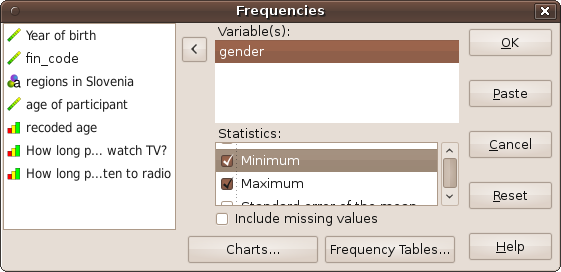
Frequencies.
Select target variables (in our example Gender) on the left side and move them by clicking to an arrow button to the right side (to “Variable(s)” list).
You can mark which additional statistics should be computed (however, this depends of the type of variable; it is not reasonable to compute average of gender). Available statistics are:
-
mean
-
standard deviation
-
minimum (shows minimum value of variable)
-
maximum (shows maximum value of variable)
-
standard error of the mean
-
variance
-
skewness
-
standard error of the skewness
-
range
-
mode
-
kurtosis
-
standard error of the kurtosis
-
median
-
sum
There are two additional options, Format, which defines the format of the output tables and Charts, where we can select what charts to draw. Frequency table could be sorted by ascending or descending order (of values) or by ascending or descending counts. It is also possible to suppress tables with to many categories (number can be setted). PSPP can draw histogram or pie chart.
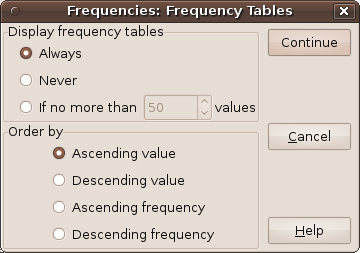
Frequencies – Frequency Tables button.
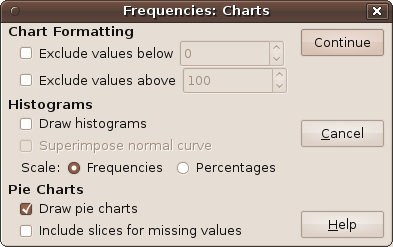
Frequencies – drawing charts.
By clicking on button OK, analysis is run. By clicking on button Paste appropriate syntax is pasted into syntax editor window, where it can be saved and run later.
Syntax:
FREQUENCIES
	/VARIABLES= gender
	/FORMAT=AVALUE TABLE
	/STATISTICS=MINIMUM MAXIMUM
	/PIECHART=.
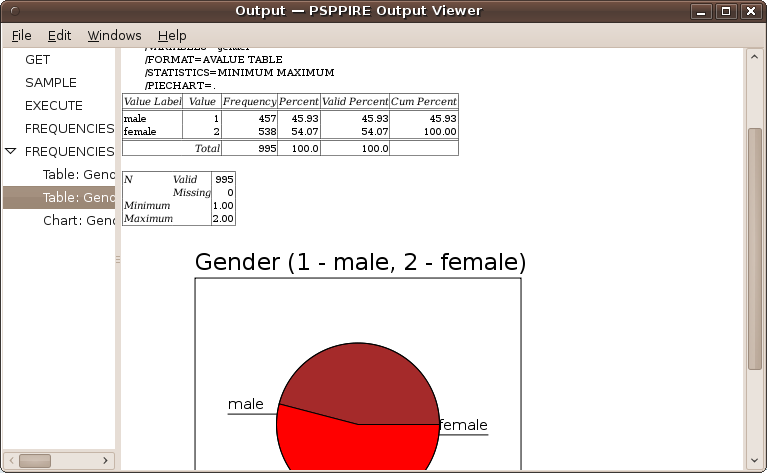
Output of frequencies.
Results show, that in the dataset are 995 cases 45.93% is male and 54.07% is female.
Descriptives
To compute descriptive statistics go to Analyze – Descriptive statistics – Descriptives. Available statistics are:
-
mean
-
standard deviation
-
minimum (shows minimum value of variable)
-
maximum (shows maximum value of variable)
-
range
-
sum
-
standard error
-
variance
-
kurtosis
-
skewness
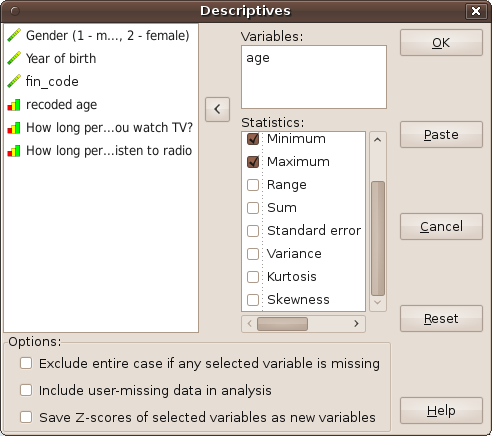
Descriptives.
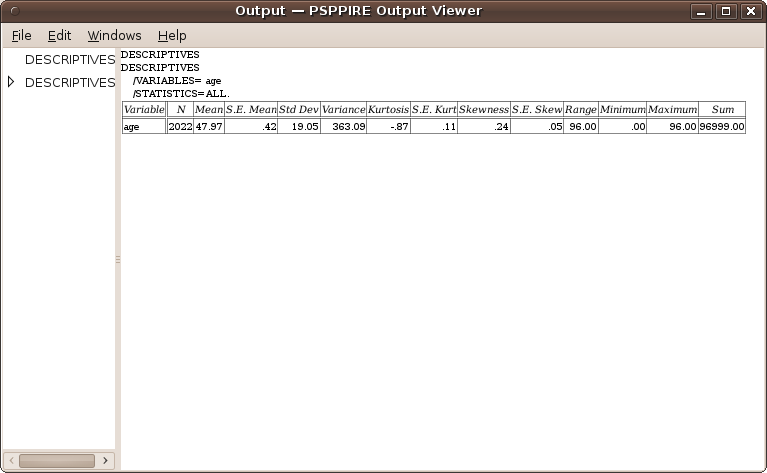
Output of descriptives.
Results show, that in the dataset are 2022 cases and mean age is 47.97 years.
Ključne besede: PSPP