Selecting, filtering and sampling data
This page is a part of PSPP Guide.
PSPP can do several operations to select, filter and sample data.
Filtering with boolean-valued variable
PSPP uses FILTER command to select cases from the data stream for processing. Cases which have a zero or system mising or user missing value at the filter variable are excluded from analysis. This command is not available through graphical interface, but can be used from syntax.
Limit the number of cases
N OF CASES command limits the number of cases processed by any procedures that follow it in the command stream. If we want to disregard all cases after the first 100, we can use command N OF CASES 100. This command is not available through graphical interface, but can be used from syntax.
Sampling and selecting data
To select a sample of data go to Data – Select cases.
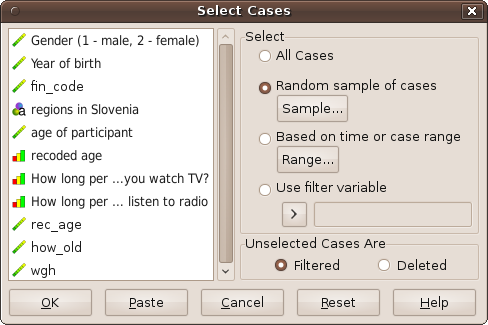
Data sampling wizard.
PSPP allows user to select random sample of cases (Mersenne twister random number generator is used), to select sample on time or case range or to select sample based on filter variable (for instance select only females, i.e. cases which has value 2 in variable gender).
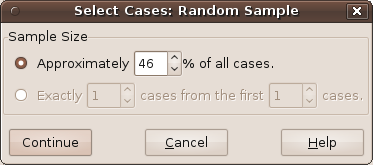
Random sampling.
Sampling random samples may (should) result in different samples. To obtain the same sample, use the SET command to set the random number seed to the same value before each SAMPLE. Different samples may still result when the file is processed on systems with differing endianness or floating-point formats. By default, the random number seed is based on the system time.
PSPP also offers option to filter or delete unselected cases. However, due to some programming error filtering (instead of deleting) of not selected cases is not working yet.
When you click OK, transformation is not executed immediately, but it is pending. This is because sometimes large datasets are in use and transformations take a lot of time. That means transformations should be activated manually. This can be done by pressing Ctrl-G or through menu Transform – Run pending transforms.
Splitting file
If you want to organize output by groups, for instance compute mean age and display results frequency table separated for male and female go to Data – Split file and select Organize output by groups.
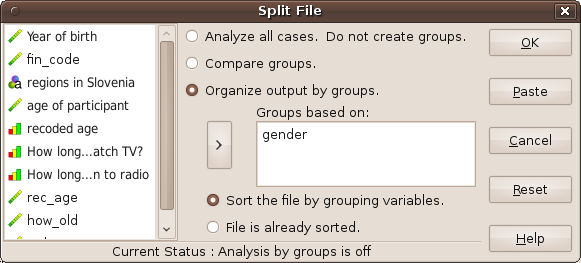
Splitting file.
In our case we will select variable gender (move it to area ”Groups based on”). All further analysis will then be separated for male and female. For instance, if we compute mean (through descriptives), output is separated on variable gender.
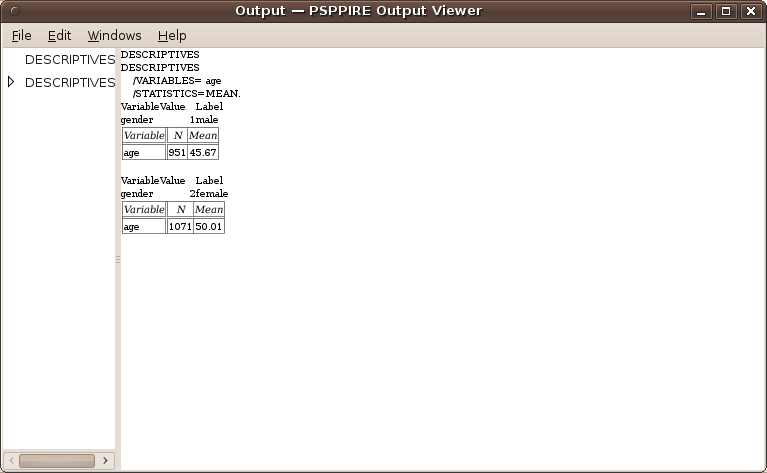
Results of mean computation on a split file.
As we can see, average age for male is 45.67 and age for female is 50.01.
Ključne besede: PSPP